Worldwide tablet sales declined yet again in the fourth quarter of 2015 (4Q15) with 65.9 million units shipped, down -13.7% year over year, according to preliminary data from the International Data Corporation (IDC) Worldwide Quarterly Tablet Tracker. Total shipments for 2015 were 206.8 million, down -10.1% from 230.1 million in the prior year. Despite the market’s negative trajectory overall, shipments for detachable tablets reached an all-time high of 8.1 million devices.
The transition towards detachable devices appears to be in full swing as pure slate tablets experienced their greatest annual decline to date of -21.1%. On the other hand, detachable tablets more than doubled their shipments since the fourth quarter of last year.
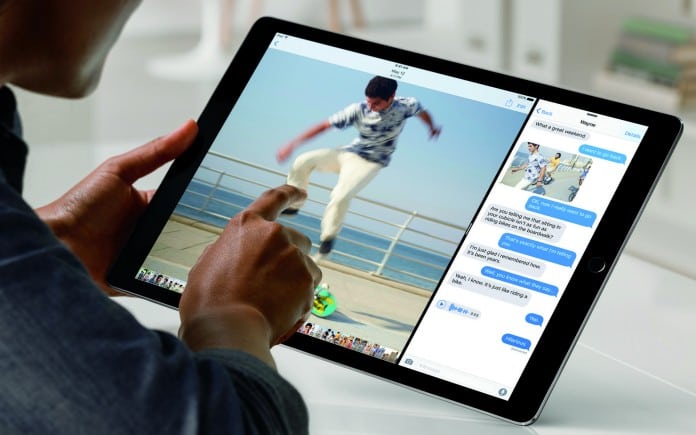
Despite lukewarm reviews, the iPad Pro was the clear winner this season as it was the top selling detachable, surpassing notable entries from Microsoft and other PC vendors. It’s also important to note that the transition towards detachable tablets has presented positive opportunities for both Apple and Microsoft. However, Google’s recent foray into this space has been rather lackluster as the Android platform will require a lot more refinement to achieve any measurable success.
The most interesting trend to note is that prices on slate tablets have not yet hit rock bottom. Amazon’s $50 (or $42 for bulk shoppers) tablet was the holiday season’s surprise hit, garnering the number 3 rank among the worldwide top 5. Rival vendors like Huawei and Lenovo also continued to focus on the low end while also expanding outside their home country China.
“One of the biggest reasons why detachables are growing so fast is because end users are seeing those devices as PC replacements,” said Jean Philippe Bouchard, Research Director, Tablets at IDC. “We believe Apple sold just over two million iPad Pros while Microsoft sold around 1.6 million Surface devices, a majority of which were Surface Pro and not the more affordable Surface 3. With these results, it’s clear that price is not the most important feature considered when acquiring a detachable – performance is.”
Tablet Vendor Highlights
Apple’s reign as market leader continued in 4Q15 though the company faced a -24.8% year-over-year decline. With the successful launch of the iPad Pro, the company was able to curb the decline in iPad revenues as its model mix shifted towards higher priced iPads.
Samsung managed to keep its second position in the market though it did decline by -18.1% compared to last year. Samsung is the vendor with the deepest tablet portfolio and manages to reach multiple price points and screen sizes, a position that will facilitate the transition to detachables in 2016.
Amazon’s latest Kindle iteration piqued everyone’s interest with its low price point, allowing Amazon’s annual growth to reach 175.7%, the highest amongst the top 5. Amazon’s success in the tablet market has thus far been purely based on price. While this bodes well during the holiday season, it’s unlikely the Kindle’s success will continue in the remainder of the year.
Lenovo maintained its market share in the last quarter of 2015, shipping 3.2 million units for a -13.5% decline over the same period last year. However, the Yoga, MIIX, and Thinkpad brands’ combined traditional PC savoir faire should help Lenovo regain market share in 2016.
Huawei’s focus remains on cellular-connected tablets and international expansion. The company has positioned itself well in the adjacent smartphone market and its popularity is likely to bleed over into the tablet market.
| Top Five Tablet Vendors, Shipments, Market Share, and Growth, 2015
(Preliminary Results, Shipments in millions) |
|||||
| Vendor | 2015 Unit Shipments | 2015 Market Share | 2014 Unit Shipments | 2014 Market Share | Year-Over-Year Growth |
| 1. Apple | 49.6 | 24.0% | 63.4 | 27.6% | -21.8% |
| 2. Samsung | 33.4 | 16.2% | 39.8 | 17.3% | -16.1% |
| 3. Lenovo | 11.2 | 5.4% | 11.2 | 4.9% | 0.4% |
| 4. ASUS | 7.1 | 3.4% | 11.8 | 5.1% | -39.9% |
| 5. Huawei | 6.5 | 3.1% | 3.0 | 1.3% | 116.6% |
| Others | 99.1 | 47.9% | 100.9 | 43.8% | -1.8% |
| Total | 206.8 | 100.0% | 230.1 | 100.0% | -10.1% |
| Source: IDC Worldwide Quarterly Tablet Tracker, February 1, 2016 | |||||


