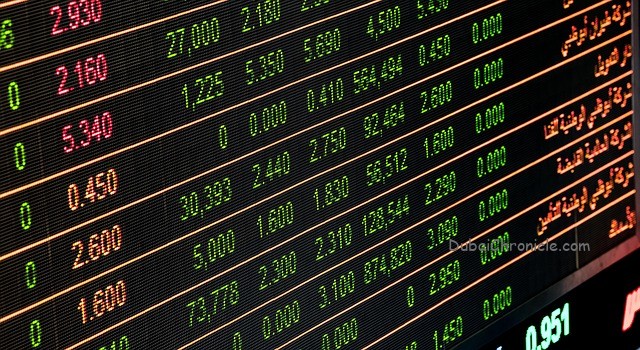
Global equities recorded the worst weekly performance since March as selling pressure was triggered by cautious tone of the US Fed and news of an acceleration in new infection post easing lockdowns. The ability of governments globally to successfully and sustainably reopen economies is likely to play an important role in determining the revival in demand and pace of recovery in global economies in the coming months.
Oil prices also fell by 8.44% during the week, after recording gains in past few weeks. In MENA, the equity markets performed positively during the week as investors were encouraged by a slower-than-expected contraction in regional economies. However, the regional markets were not influenced by the decline in oil prices recorded during the week.
For the week, 5 out of the 7 regional indexes closed in green while 3 closed in red. Dubai was the best performing index regionally with gains of 3.13%, followed by 1.98% in Egypt, 1.91% in Kuwait, 1.42% in Saudi Arabia, and 0.55% in Bahrain. On the other hand, Abu Dhabi was down 0.19%, followed by 0.11% in Oman.
Going forward, signs of long-term recovery in global economies is likely to push the equity markets higher but investors should be prepared to face volatility amid all the uncertainties. Moreover, key economic data such as retail sales and housing related data in the US is likely to influence the trading activity during the week.
For the regional markets, investors will continue to focus on the positive impact of reopening of economies, especially the pick-up in activity in the non-oil sector. Moreover, the regional markets will be able to gauge the real damage caused by the pandemic, which is likely to become clearer from businesses reopening at reasonable capacity going forward.
| Indexes | Last | WTD (%) | MTD (%) | YTD (%) | |
| Dubai (DFMGI) | ▲ | 2,103.25 | 3.13% | 8.13% | -23.93% |
| Abu Dhabi (ADSMI) | ▼ | 4,294.88 | -0.19% | 3.70% | -15.38% |
| Saudi (SASEIDX) | ▲ | 7,309.80 | 1.42% | 1.34% | -12.87% |
| Kuwait (KWSE) | ▲ | 4,242.11 | 1.91% | 2.21% | -13.61% |
| Egypt (EGX30) | ▲ | 10,831.92 | 1.98% | 5.99% | -22.42% |
| Bahrain (BHSEIDX) | ▲ | 1,280.38 | 0.55% | 0.85% | -20.48% |
| Oman (MSM30) | ▼ | 3,513.67 | -0.11% | -0.87% | -11.74% |
| Commodities | Value | WTD (%) | MTD (%) | YTD (%) | |
| Gold (s/OZ) | ▲ | 1730.8 | 2.67% | 0.14% | 14.09% |
| Silver ($/Oz) | ▲ | 17.49 | 0.36% | -2.10% | -1.91% |
| WTI ($/bbl) | ▼ | 36.56 | -6.18% | 3.51% | -40.12% |
| Natural Gas | ▼ | 1.75 | -2.78% | -4.89% | -20.05% |
| OPEC Oil ($/bl) | ▼ | 38.73 | -8.44% | 2.35% | -41.32% |
| Copper ($/MT) | ▲ | 5786.66 | 3.62% | 8.25% | -6.67% |
| Aluminium ($/MT) | ▲ | 1593.5 | 1.36% | 3.68% | -12.57% |
| FX Rates | Value | WTD (%) | MTD (%) | YTD (%) | |
| USD/AED | ▲ | 3.6732 | 0.00% | 0.01% | 0.01% |
| USD/SAR | ▼ | 3.7535 | -0.04% | -0.06% | 0.07% |
| USD/EGP | ▼ | 16.18 | -0.35% | 2.13% | 1.13% |
| USD/EUR | ▲ | 0.8885 | 0.28% | -1.34% | -0.36% |
| USD/JPY | ▼ | 107.36 | -2.03% | -0.44% | -1.15% |


